Measure Room Modes: Smartphone Acoustic Guide
By Avery Cole • 3rd Mar
You don't need expensive measurement gear to understand what your room is doing below 300 Hz. A smartphone, a free acoustic analysis app, and twenty minutes of methodical testing will show you exactly where room modes are coloring your mixes. Here's how to measure them and what to do with the data. If you plan to calibrate levels with a phone, see our smartphone calibration guide for accurate mixes at quiet volumes.
What Are Room Modes and Why Should You Measure Them?
Room modes are standing waves that bounce between your walls and either amplify or cancel certain frequencies. They occur at frequencies whose half-wavelength (or multiples of that) equals your room's dimensions (length, width, or height). In residential rooms, modes below 250 Hz are spaced far apart, creating uneven bass response. For placement fundamentals and starter treatment that reduce this issue, read our monitor placement and room treatment essentials. This is why your kick drum pounds in one corner and vanishes in another.
Low-frequency room modes are the primary culprit in small-room mixing problems. A mode at 80 Hz will also resonate at 160 Hz, 240 Hz, and higher harmonics. That's not just about bass, it affects your entire frequency decision chain. If your 80 Hz mode is coloring kick and sub choices in the sweet spot, those decisions crumble the moment you move or play the mix elsewhere.
Measuring your modes is the first repeatable step. Numbers don't lie. Ears adapt and rationalize.
How Do Room Modes Form?
Room modes arise from axial, tangential, and oblique reflections. Axial modes (the strongest type) form between opposite, parallel boundaries like front and back walls or floor and ceiling. These dominate in compact rooms and are the ones you'll measure most easily.
When a sound wave bounces between two walls, it either reinforces itself (creating a peak) or cancels itself (creating a dip). Walk across your room playing a 50 Hz tone and you'll feel this immediately: the tone roars near walls (high pressure zones) and nearly disappears in other spots (low pressure zones). That's your room mode at work.
The mathematics is simple. The lowest axial mode = speed of sound / (2 x room length). For a 12-foot room: 343 m/s / (2 x 3.66 m) ~ 47 Hz. Repeat the formula with width and height to find the next two strongest modes. These three frequencies are your room's acoustic fingerprint.
Why Smartphone Measurement Works (And Its Limits)
Smartphones aren't precision instruments, but they're accurate enough for room mode identification in the 40-300 Hz range where it matters most. Most modern phones include a calibrated microphone and can run simple FFT (Fast Fourier Transform) analysis apps that detect peaks and resonances.
What smartphones cannot reliably do: measure absolute SPL with lab accuracy, detect phase relationships below 50 Hz, or capture the full decay signature of a mode across multiple seconds. But what they can do is show you which frequencies ring and where pressure zones live.
For room mode work, that's enough.
Step-by-Step: Measure Your Modes with a Smartphone
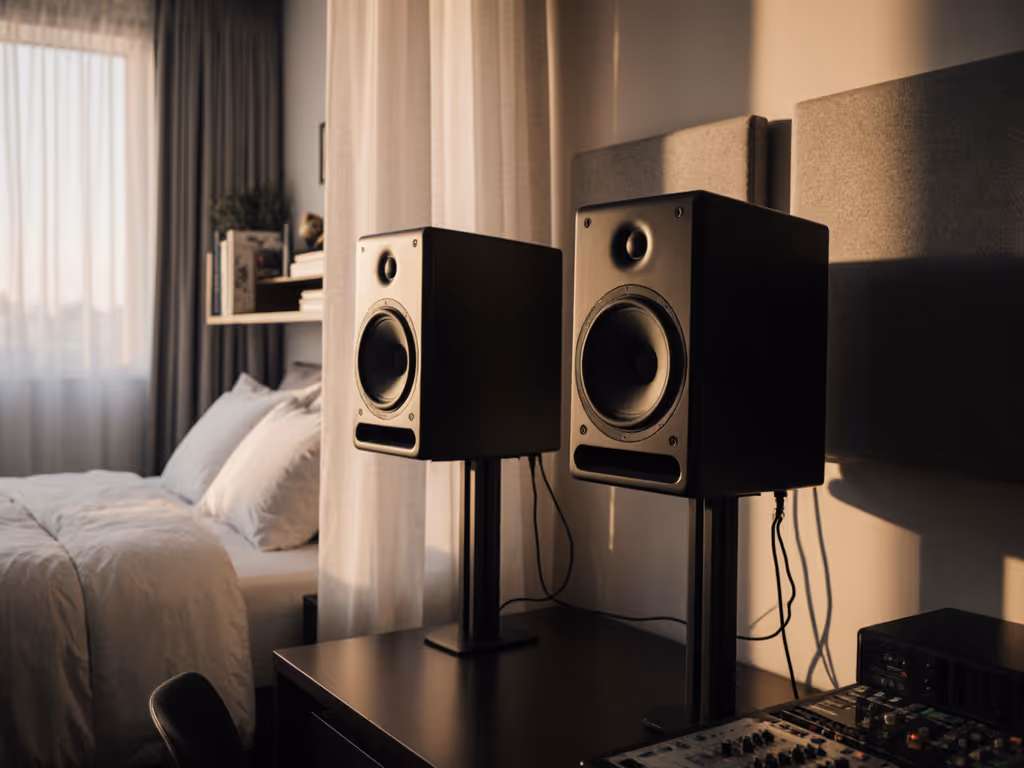
Preparation
Clear your monitoring desk. Move the smartphone to your normal ear position (exactly where you sit to mix). Silence background noise: phone on airplane mode, close windows, ask roommates to step out. You need 5-10 minutes of quiet.
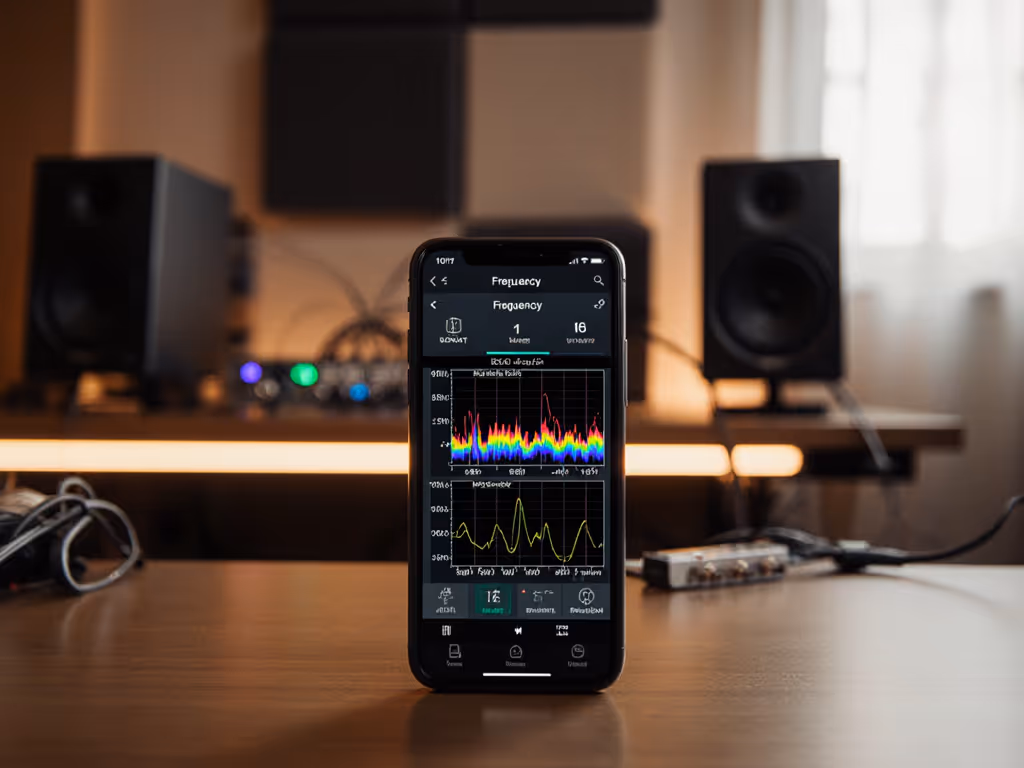
Step 1: Choose an App
Free, straightforward options:
- Room EQ Wizard (Windows/Mac with phone as mic via USB or Bluetooth): generates sweep tones and records response.
- amroC (web-based): a room mode calculator; input your room dimensions and it predicts all modes and pressure zones.
- XTZ Room Analyzer II Pro (mobile): paid, but the free version shows frequency response peaks.
- Spectroid (Android, free): real-time spectrum display; identify ringing frequencies by eye.
For rapid mode identification, start with amroC: enter your room length, width, and height in meters. It calculates and visualizes all mode frequencies and pressure zones instantly. This baseline saves you guesswork.
Step 2: Generate a Sweep Tone
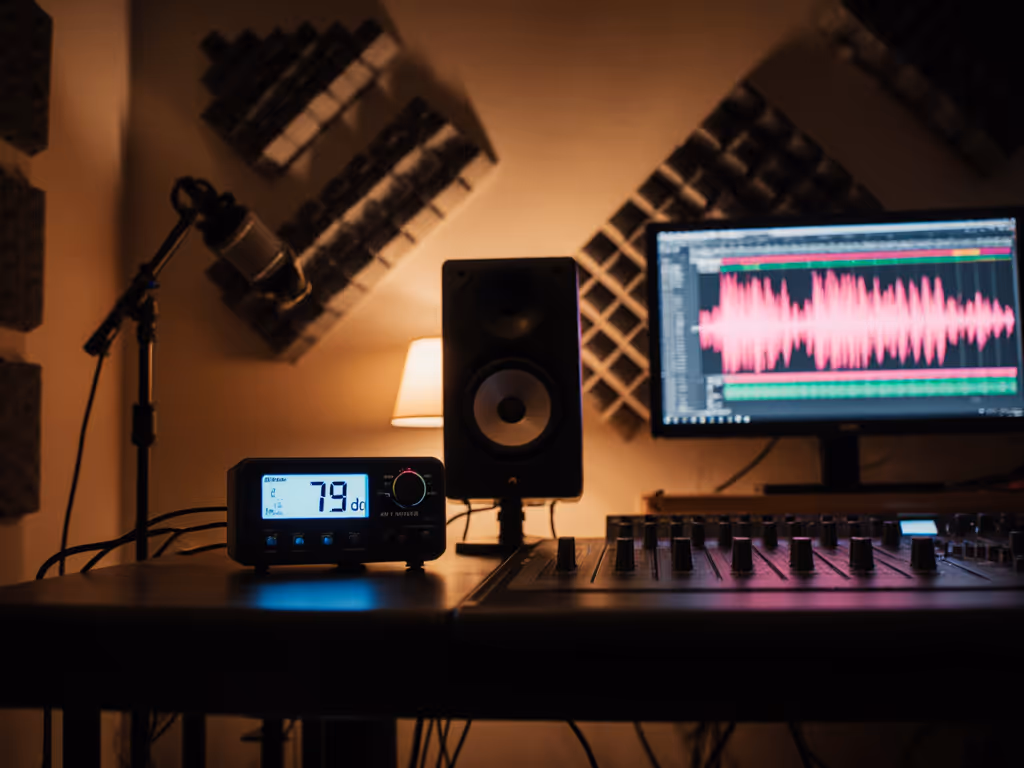
Use Room EQ Wizard or a tone-generator app to play a logarithmic sine wave sweep from 20 Hz to 200 Hz through your monitors, one side at a time. Play it at a reference level (70 dB is standard, measured at your ear position with a simple SPL meter app). Learn how to set safe, translation-friendly monitoring levels without sacrificing accuracy.
Listen carefully. Note which frequencies feel loudest and which disappear. These are your modes and nulls.
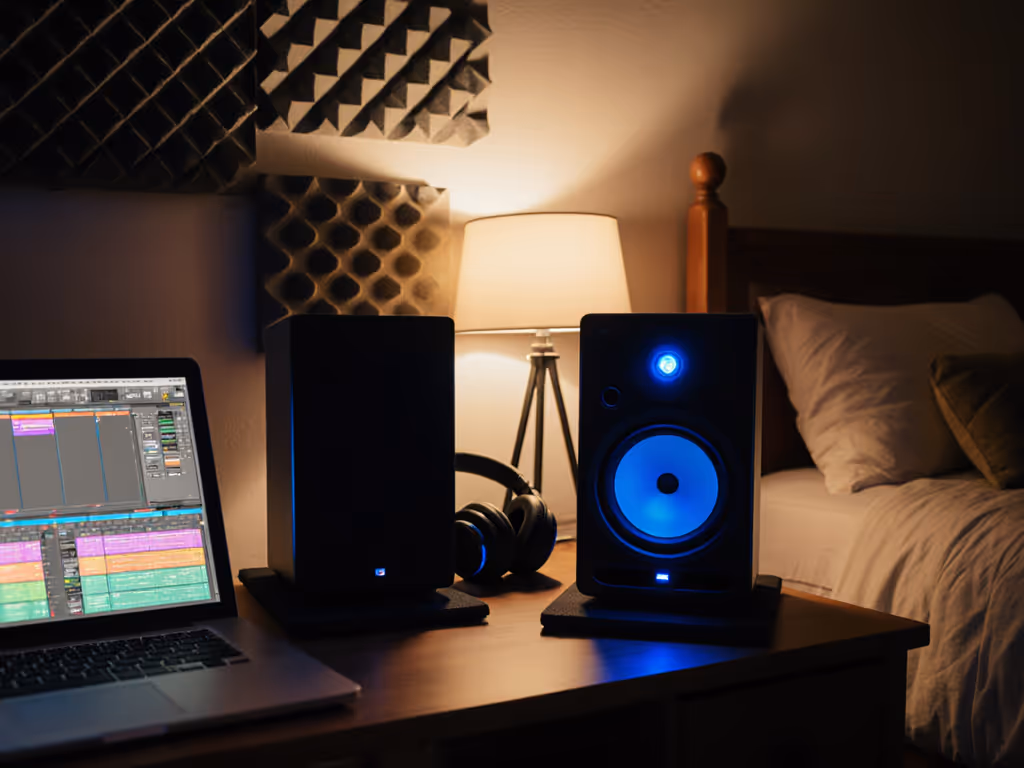
Step 3: Record the Frequency Response
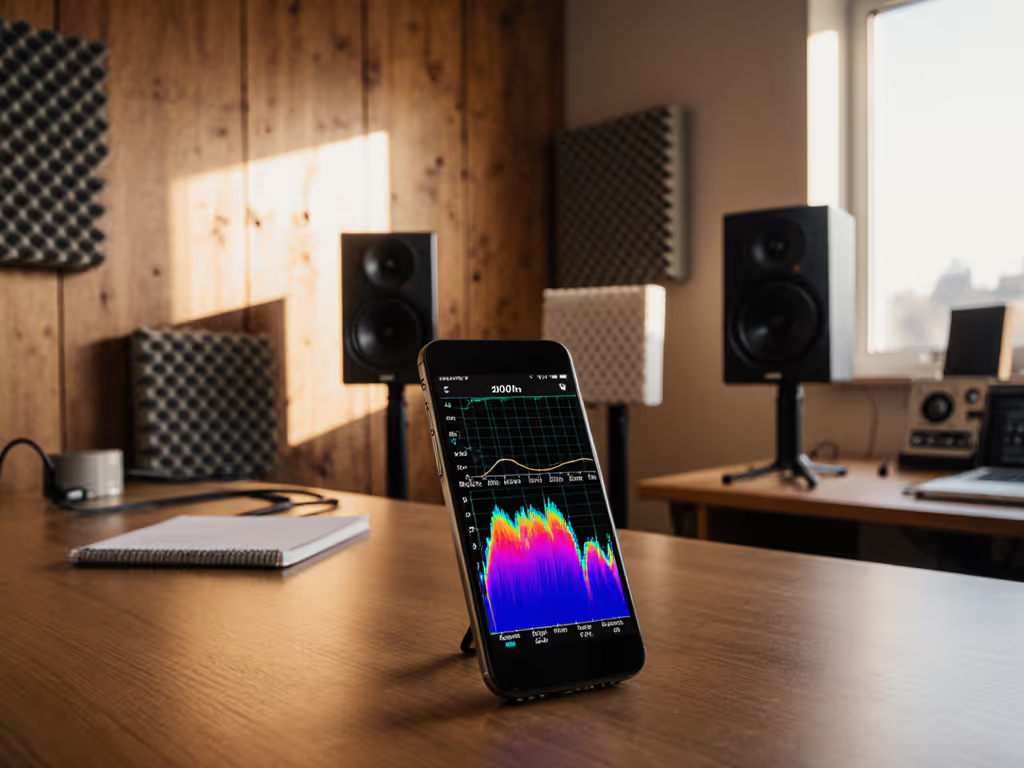
If using Room EQ Wizard, let it log the response in real time. If using Spectroid or a spectrum app, start the recording, run the sweep again, and watch the waterfall. Peaks that appear and linger are room modes; clean, quick peaks are reflections from surfaces.
Take a screenshot. You now have visual proof of what your room is doing.
Step 4: Cross-Check with Position Movement
This is the real-world validation. Stay at your monitoring position and play a steady 60 Hz sine wave at 72 dB. Now move your head forward 6 inches, backward 6 inches, left and right by the same amount. If the level changes noticeably (more than +/- 3 dB), you're moving in or out of a pressure zone.
Repeat at 80 Hz, 100 Hz, and 120 Hz. Document which frequencies change most with movement. That's your room's strongest modes and the frequencies most vulnerable to small desk shifts.
Step 5: Map Pressure Zones (Optional But Valuable)
Use amroC's 3D visualization to see exactly where your monitors and listening position fall relative to pressure zones of your calculated modes. If your monitor is deep inside a pressure zone for a particular frequency, it will overshoot that mode. If your ear sits in a null, you'll hear less than is actually present.
Don't overthink this step (the smartphone sweep already showed you the problem). The visualization just confirms why.
What to Do with Your Room Mode Data
You now have a repeatable measurement. Three immediate actions:
Control the desk bounce. Move your monitors or listening position to the 38% rule: place them roughly 38% of the distance from your front to back wall. This is statistically the best spot for even modal distribution. To minimize desk reflections and set proper tweeter height, follow our monitor height and desk reflection guide. If your desk is locked in place, shift your chair forward or backward by 12-18 inches and re-measure. Even small movements change which modes you excite.
Check the gaps. Where are the nulls (frequencies that measure 6+ dB quieter than neighbors)? These are the frequencies most likely to disappear in your mixes. Mark them. When mixing bass, vocals, or kick drums at those frequencies, A/B against reference tracks on earbuds or another device. If it sounds right elsewhere but thin in your room, you're in a null.
Run a five-point reference loop. Play the same mix on your monitors, then on earbuds, a Bluetooth speaker, and in your car at 72 dB. Which devices reveal problems your monitors hide? This is how you discover if your modes are lying to you. That five-track, three-checkpoint loop I built years ago (pink noise alignment, spot checks at 72 dB on multiple playback systems) became my trust metric. If it translates at 72 dB, it translates everywhere.
Common Questions
Can a smartphone app replace a measurement mic? No. But it can replace guesswork. A $10 app and five minutes of sweeping will catch 80% of modal problems. When you need surgical precision (phase relationships, sub integration, final DSP tuning), rent a USB measurement mic for $30-50. Until then, smartphones eliminate the biggest pain: not knowing what's wrong.
What if my room is irregular (sloped ceiling, furniture, windows)? Your calculated modes will be estimates. The actual resonances may shift 5-10% in frequency. That's why you measure, not calculate. The sweep tone and Spectroid will show you reality, not theory.
Should I treat my room first or measure first? Measure first. You can't fix what you can't see. Once you know which frequencies are problematic, you decide: move your position, add bass traps in pressure zones, or accept the mode and learn to reference-check at that frequency.
Do modes matter above 250 Hz? Not significantly. Above 300 Hz, modes pack so tightly and their harmonics align so evenly that their effects smooth out and become much less audible. Your mode-measurement work targets the 40-200 Hz range where single, isolated resonances wreck mixes.
Summary and Final Verdict
Smartphone acoustic analysis is your entry point to trustworthy, repeatable room measurement. Download a free app (amroC to predict, Spectroid to measure), spend 20 minutes with a sine wave sweep, and map your pressure zones. Move your monitors or listening position to the calculated best spot. Then reference-check the same mix on earbuds, a Bluetooth speaker, and a car (all at 72 dB).
The data isn't a solution; it's a map. You'll still need bass traps, strategic positioning, or DSP correction to truly neutralize your modes. But measurement is the only reliable first step. Ears rationalize and adapt; frequency response graphs don't.
Start measuring this week. Build the habit of checking your work at multiple SPLs and devices. Your car will tell you what your room lies about. Trust that, not the feeling in the room.
Related Articles