Studio Monitor Polar Response: Translation Decoded
By Lila Okafor • 16th Apr
Understanding studio monitor polar response isn't academic trivia. It is the bridge between lab measurements and the real acoustics of your untreated 10-by-12-foot bedroom or apartment control room. A speaker's polar pattern translation reveals how its frequency content spreads across angles, and in small rooms where reflections dominate every surface, that directivity pattern directly shapes what you hear and, crucially, what decision you'll make at the mix. Curves matter, but only as far as rooms allow. For practical setup steps that complement polar response, read our room treatment and monitor placement essentials.
What Is Polar Response in Studio Monitors?
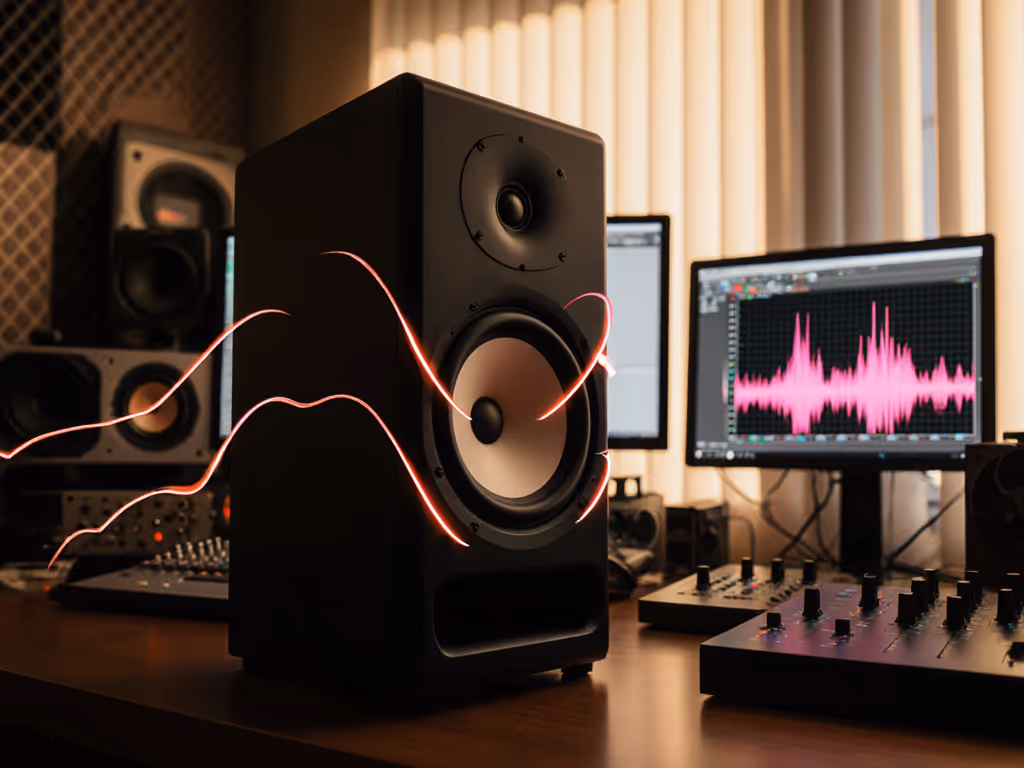
Polar response (or polar pattern) documents how a studio monitor radiates sound energy at different angles: not just straight ahead, but to the sides, above, and behind. Rather than treating a speaker as a single-point energy source, polar patterns map its actual behavior across the frequency spectrum. At low frequencies (100-300 Hz), a speaker radiates relatively omnidirectionally; at high frequencies (4-20 kHz), output becomes highly focused and directional.
This isn't abstract. In a small room with your desk against a side wall and a window behind you, a speaker with poor horizontal off-axis consistency will smear midrange into the back wall, cancel bass at certain listening angles, and collapse stereo imaging the moment you lean back. When monitors behave unpredictably at 30 or 45 degrees off-axis, you lose confidence in EQ decisions that sounded solid on-axis, and those decisions fail on earbuds, car systems, and consumer speakers where off-axis listening is the norm. Predictable off-axis wins.
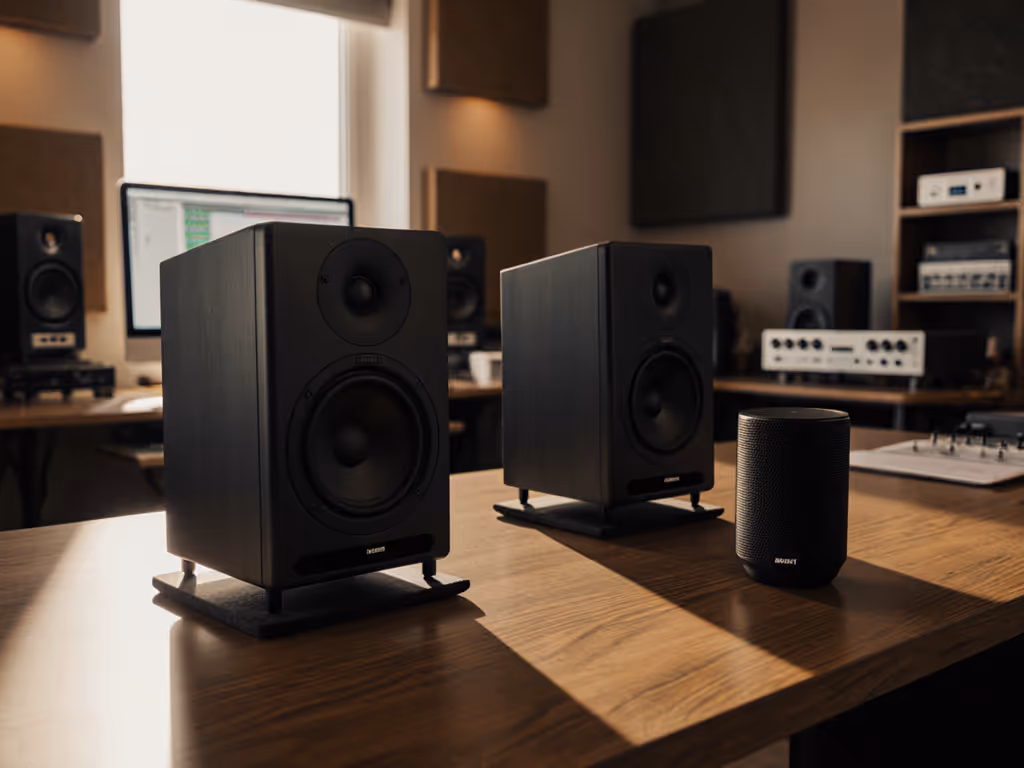
Horizontal vs. Vertical Dispersion
Horizontal vs vertical dispersion describes two distinct behaviors. Horizontal dispersion maps how sound spreads left and right of the speaker's central axis. Most studio monitors are engineered to maintain relatively flat response across ±30 to ±60 degrees horizontally, especially through the critical midrange (250 Hz-4 kHz). This matters: if your left monitor's midrange only translates on-axis, a 6-inch sideways head movement invalidates your mix decision.
Vertical dispersion (radiation above and below the speaker's tweeter height) is steeper by design. High-frequency content typically narrows dramatically as you move off-axis vertically. This is why tweeter height (ideally at ear level when seated) and monitor tilt are non-negotiable in small spaces. Even a 15-degree upward tilt can shift presence and mask desk-boundary reflections that would otherwise color vocals and dialogue.
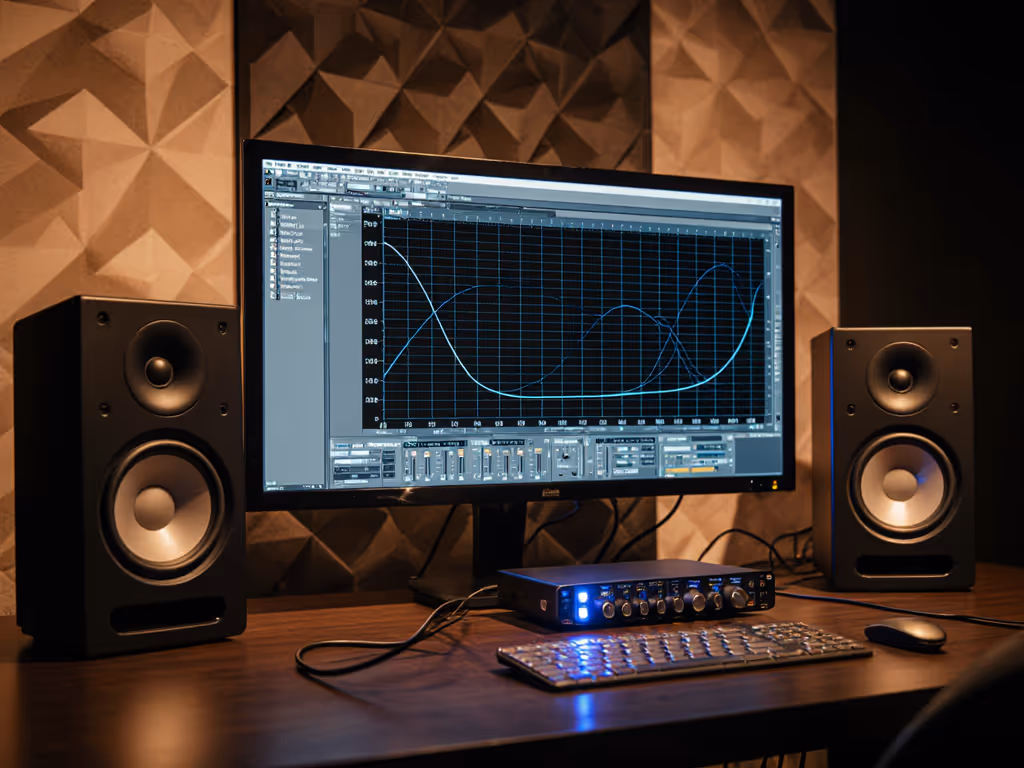
Reading Polar Response Charts: The Mechanics
A normalized polar response measurement takes the on-axis response (0 degrees, directly in front of the speaker) as reference (0 dB), then subtracts that from all other off-axis angles. The result is a chart scaled from 0 to -30 dB, where contours at each frequency show how much energy drops as you move off-axis.
Reading these charts requires a few mental shifts:
- Closer to zero = flatter off-axis response. A monitor whose 2 kHz contour stays within ±5 dB from 0 to ±60 degrees is more forgiving in a small room than one that plunges to -15 dB at ±45 degrees.
- High frequencies roll off faster. As frequency increases (especially above 4 kHz), the contours narrow sharply. This is expected; the question is how sharp. A balanced taper is preferable to a cliff, which causes harshness at extreme angles and excessive ear fatigue when slightly off-axis.
- Low frequencies don't narrow much. Below 500 Hz, most studio monitors radiate relatively omnidirectionally (contours extend to ±90 degrees or beyond). To understand how high-frequency dispersion is shaped, explore our waveguide design comparison. This is why desk and wall placement matter more for bass than tweeter pointing: bass modes are set by geometry, not directivity.
Measurement Caveats
Polar response measurement standardizes distance (typically 1 meter in anechoic conditions) and test SPL (often 90 dB). In your apartment mixing at 70-75 dB SPL, nonlinear driver behavior (voice-coil thermal effects, suspension stiffness) may shift actual dispersion slightly, especially at very low playback levels. Directivity also tightens when cabinet resonances couple with room modes, a phenomenon lab plots don't capture. This is why placement and room treatment remain critical even with excellent off-axis specs. The polars show potential; your room reveals reality.
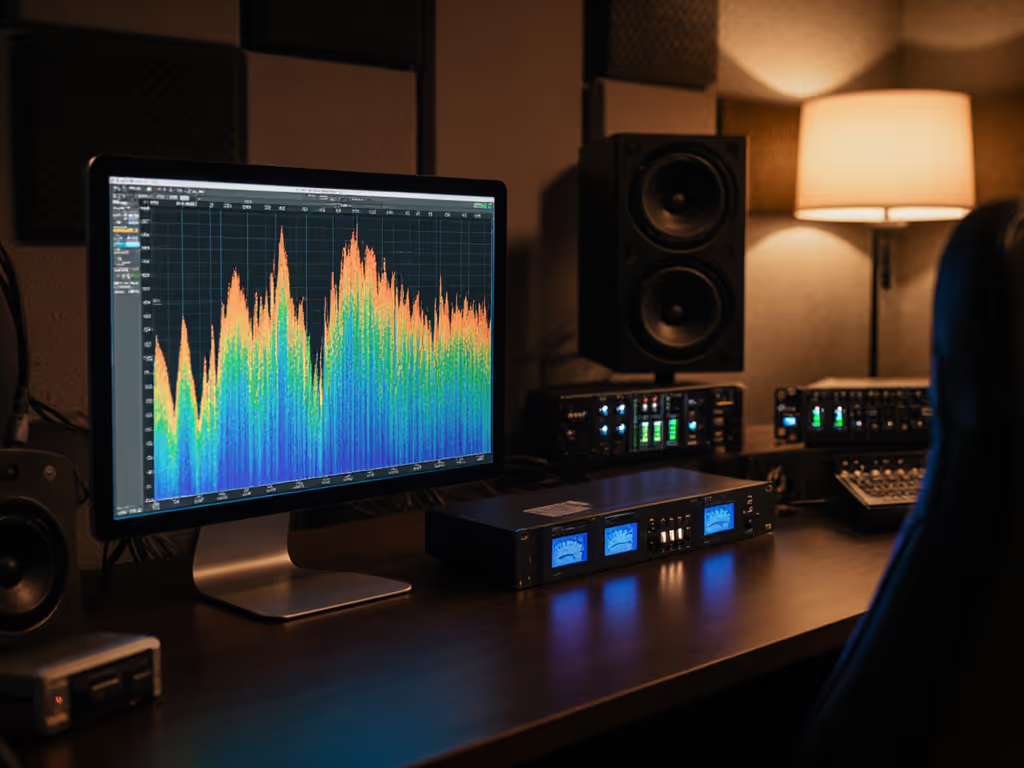
Frequency-Dependent Directivity: The Small-Room Problem
Frequency-dependent directivity means that a speaker's directivity pattern is not constant across the frequency range; different frequencies point in different directions.
Consider a typical 5-inch nearfield monitor:
- 150 Hz: radiates broadly; placement within a foot of a wall causes constructive/destructive interference (room modes).
- 1 kHz: starts to narrow; a 30-degree off-axis angle introduces a -3 to -5 dB dip.
- 8 kHz: highly focused; only on-axis (±5 degrees) remains truly flat.
In a small, reflective room, this creates a dilemma. Your mixing position is determined by desk placement (usually centered 0.8-1.2 m from the speakers), but that position is rarely ideal for all frequencies. Bass modes cluster in room corners; mid-range beaming occurs at off-axis angles; treble harshness emerges from excessive reflections. A monitor with controlled directivity (smooth, predictable off-axis behavior) becomes the foundation for decisions that stick. If sweet spot limitations are a concern, compare coaxial vs traditional 2-way monitors for their dispersion trade-offs.
This principle emerged clearly during a recent mix session with a client. They were mixing pop vocals on a monitor with a showroom top end but uncontrolled horizontal beaming. At their desk, the presence peak sounded bright and exciting until I overlaid their room's 200 Hz bump (from the desk edge acting as a boundary). We cut the desk height by 4 inches, tweaked toe-in from 15 degrees to 22 degrees, and applied a low-latency shelf filter to tame the monitor's upper midrange. The sparkle stayed. Revision requests didn't. Predictable directivity, paired with simple geometry, eliminated guesswork.
Practical Translation: Polar Response and Mixing Decisions
Why does polar response matter to your mixes on Spotify, YouTube, and Apple Music? Because those consumption platforms apply playback normalization across device speakers (earbuds, car systems, smart speakers), all with wildly different directivity patterns. If your monitors deceive you through unpredictable off-axis behavior, your EQ and balance choices collapse elsewhere.
Monitors with stable off-axis consistency (typically those maintaining ±2 to ±4 dB of midrange flatness across ±60 degrees) offer two advantages in small rooms: See real-world comparisons in our off-axis response data review.
- A wider usable listening area. You can recline slightly, shift your posture, or accommodate a client sitting to the side without the mix crumbling.
- Less room-coupling anxiety. Reflections from your side wall or desk still happen, but they're balanced by your monitor's controlled directivity rather than exacerbated by beaming.
Combined with proper tweeter height (at ear level when seated), moderate toe-in (typically 0-15 degrees inward), and distance from the front wall (43 inches or more, when possible), controlled directivity becomes predictable. This pairing of off-axis consistency and placement discipline is what separates monitors that inform your work from monitors that merely impress during a showroom demo.
Common Misconceptions
Misconception: Wider polar patterns mean more bass. Not inherently. A monitor might radiate low frequencies omnidirectionally yet still introduce a 6 dB peak at 80 Hz due to boundary coupling. Polar response describes directivity, not magnitude. Room modes depend on placement geometry and room dimensions, not polar pattern shape.
Misconception: Narrower high-frequency directivity means the monitor is colored. Tighter high-frequency beaming is normal and often desirable in small rooms, it reduces reflections. The risk is uneven narrowing, where some midrange frequencies beam while adjacent bands do not, creating tonal inconsistencies as you move your head.
Misconception: Correction software fixes polar response problems. Digital room correction tools can flatten in-room response measured at one point, but they cannot create a wider listening area or prevent off-axis reflections from affecting your imaging. Placement and monitor selection come first; correction addresses what curves and geometry leave behind.
Interpreting Data for Your Space
When evaluating a monitor's polar response for a small room, look for:
- Midrange stability (250 Hz-4 kHz) across ±45 degrees. This frequency band drives vocal intelligibility and mix decisions. A ±3 dB window is excellent; ±5 dB is acceptable; ±8 dB or more suggests placement will be critical.
- Gradual high-frequency narrowing above 4 kHz. Abrupt cliffs (contours plunging from -2 dB to -12 dB in a single kilohertz) indicate potential harshness or ear fatigue at off-axis angles.
- Low-frequency omnidirectionality. Confirm that 100-300 Hz spreads to at least ±70 degrees. If bass response is already directional, desk placement must be even more precise.
- Tweeter/port radiation patterns. Rear-ported monitors are sensitive to wall distance; forward-ported designs offer more flexibility. Polar charts often show these distinctions.
The Translation Hierarchy
- Tweeter height. Ear-level positioning shapes vertical imaging and reduces ceiling/floor reflections.
- Distance from front wall. Moving a monitor 18-24 inches farther from the front wall often reduces 100-200 Hz boom more than any EQ.
- Off-axis consistency. A monitor with stable midrange directivity forgives imperfect placement better than a highly tuned but narrow-sweet-spot design.
- Toe-in angle. Fine-tune after the above are set; typically 10-25 degrees works for most nearfield setups.
Takeaway: Curves and Context
A speaker with a stable polar response, one that maintains consistent off-axis behavior through the critical midrange and treble, becomes a predictable tool in an imperfect room. It's not the whole story; room treatment, placement discipline, and your own listening attention remain essential. But in small spaces where square footage is premium and perfection is impossible, a monitor that doesn't lie when you're slightly off-axis is the difference between mixes that translate and mixes that require endless reference checks.
The best polar response for your room is the one matched to your nearest listening distance, desk geometry, and treatment reality. Understanding what the charts mean, and what they can't, keeps you focused on decisions that matter: placement, toe-in, and the discipline to evaluate your work on other systems before you ship it. Start by measuring your own nearfield angles at home, then compare your listening positions to the polar plots you find online. You'll quickly see whether a candidate monitor forgives your room or demands perfection from it.
Related Articles